Australian Statistics on Medicines 2015
Page last updated: 18 November 2016
Acknowledgments
Prepared by Vanna Mabbott and Paul Storey of the Pharmaceutical Benefits Division.
We would like to thank the following people for their help in the access and provision of data and information used in this report:
- Michael Pittman, Therapeutic Goods Administration.
- Lynda Hurley, Pharmaceutical Access Branch, Department of Health.
- The World Health Organization Collaborating Centre for Drug Statistics Methodology.
Australian Statistics on Medicine 2015
Copyright Statements:
Internet sites
© Commonwealth of Australia 2016
This work is copyright. You may download, display, print and reproduce the whole or part of this work in unaltered form for your own personal use or, if you are part of an organisation, for internal use within your organisation, but only if you or your organisation do not use the reproduction for any commercial purpose and retain this copyright notice and all disclaimer notices as part of that reproduction. Apart from rights to use as permitted by the Copyright Act 1968 or allowed by this copyright notice, all other rights are reserved and you are not allowed to reproduce the whole or any part of this work in any way (electronic or otherwise) without first being given the specific written permission from the Commonwealth to do so. Requests and inquiries concerning reproduction and rights are to be sent to the Online, Services and External Relations Branch, Department of Health, GPO Box 9848, Canberra ACT 2601, or via e-mail to copyright@health.gov.au.
Contents
- Introduction
- Information on the Australian Statistics on Medicines
- Pharmaceutical Benefits Advisory Committee
- Drug Utilisation Sub-Committee
- National Medicines Policy
- Post-Market Reviews of Pharmaceutical Benefits Scheme Subsidised Medicines
- Drug Classification
- Adverse Event Reporting in Australia in 2015
- Figure A: Origin of medicine and vaccine adverse events received by the TGA (2011‑15)
- Expert advisory committee
- Medicines Safety Update
- Supply of Pharmaceutical Benefits to Remote Area Aboriginal Health Services under section 100 of the National Health Act
- Drug Utilisation Trends
- Most commonly used drugs in the Australian community for 2015
- Table B: Top 10 drugs by defined daily dose/thousand population/day, 2015 (including the contribution of constituents of combination products)
- Table C: Top 10 drugs by prescription counts, 2015
- Table D: Top 10 PBS/RPBS drugs by total cost to Australia, 2015
- Figure C: Top 10 subsidised drugs dispensed in 2015
- Figure D: Top 10 under co-payment drugs dispensed in 2015
- Nurse Prescribing
- Table E: Nurse Practitioner—Top 10 PBS/RPBS drugs by prescription counts, 2015
- Table F: Nurse Practitioner—Top 10 PBS/RPBS drugs prescribed by total cost, 2015
- Optometrist Prescribing
- Table G: Optometrist—Top 10 PBS/RPBS drugs by prescription counts, 2015
- Table H: Optometrist—Top 10 PBS/RPBS drugs prescribed by total cost, 2015
- Tables in the Australian Statistics on Medicines
- Table 1: 2015 Under Copayment and PBS/RPBS Prescription Numbers for PBS Listed Drugs
- Table 2: Prescription Drug use, in DDD/1000/Day, for 2013 to 2015
- Glossary of Terms
- Weights and Measures
- ATC & DDD Additions and Alterations (2016)
Introduction
The data contained in the 2015 Australian Statistics on Medicines are sourced from the Department of Human Services (DHS) records of prescriptions under the Pharmaceutical Benefits Scheme (PBS) and Repatriation Pharmaceutical Benefits Scheme (RPBS). The usage of prescription medicines dispensed to in-patients in public hospitals is not available in this report. The usage of PBS/RPBS prescription medicines to out-patients, discharged patients and day admitted patients in five states of Australia and one territory are included. The units of measurement are the prescription and the defined daily dose per 1000 population per day (DDD/1000 population/day). The defined daily dose is established by the World Health Organization Collaborating Centre (WHOCC) for Drug Statistics Methodology on the basis of the assumed average dose per day of the drug, used for its main indication by adults. The drugs presented in this publication are arranged using the Anatomical Therapeutic Chemical (ATC) classification system. For more detail on this classification and the unit of measurement, please read the section ‘Information on the Australian Statistics on Medicines’. The data are presented in two major tables. Table 1 includes 2015 prescription numbers for both subsidised and under co-payment prescriptions. Cost information on the dispensing of drugs that are PBS-listed but for which no subsidy is claimed from the Australian Government is not available for the period of this report. Collection of under general co-payment PBS volume data commenced on 1 April 2012. Table 2 includes subsidised and unsubsidised prescription drug use, in DDDs/1000 population/day, for the years 2013, 2014 and 2015. It reports the DDDs for each drug, reporting the use in monocomponent (‘plain’) and in fixed dose combination formulations. Please note that the Pharmacy Guild Survey data ceased during 2012 therefore estimates of private prescription volumes are not available in the data from 2012 onwards.
Information on the Australian Statistics on Medicines
Overview
The development, monitoring and promotion of rational and cost-effective use of medications in society are dependent on accurate information on patterns of drug prescription and use. Where use is considered to be inappropriate, drug utilisation data can monitor the impact of educational or regulatory interventions, and can guide the interpretation of pharmacoeconomic analysis 1.
In Australia, community prescriptions (i.e. non-public hospital) are dispensed either as private prescriptions, funded by the patient or private health insurer, or under one of two Government subsidisation schemes—the Pharmaceutical Benefits Scheme (PBS) and the Repatriation Pharmaceutical Benefits Scheme (RPBS). These schemes were established to provide the general community (PBS) and returned servicemen and women (RPBS) with access to necessary medicinal products which are affordable, available and of acceptable standards. Since 2002 prescriptions for an increasing number of public hospital outpatients and many medicinal products supplied at discharge for in-patients have been included in the dataset. Furthermore, from 2014, Highly Specialised Drugs (HSDs) prescriptions data supply to patients on discharge, day admitted patients and outpatients receiving treatment at public hospitals (ie, hospitals that participate in the Pharmaceutical Reform Arrangements and those approved for the purpose of supplying HSD drugs) have been included in all tables reported in the Australian Statistics on Medicines.
In Australia, a new medicinal drug must gain approval for supply in accordance with the requirements of the Therapeutic Goods Act 1989. Approval is also required to extend the indications of an established drug. Applications are dealt with by the Therapeutic Goods Administration (TGA) and, for prescription drugs, advice is sought from an expert committee. From 1963 to 2009 this advice was provided by the Australian Drug Evaluation Committee (ADEC). ADEC was replaced in January 2010 with the Advisory Committee on Prescription Medicines (ACPM).
Once a prescription drug is approved for marketing, the company concerned usually applies to have the drug listed on the PBS. This is the national scheme available to the Australian community for subsidising the cost of pharmaceuticals. The subsidised cost, particularly for newer drugs, reduces consumers’ out of pocket expenses therefore many companies seek to have the drug listed on the scheme to facilitate viable marketing.
The Pharmaceutical Benefits Advisory Committee (PBAC) makes recommendations to the Australian Government about which drugs should be listed on the PBS. Pre-market evaluation addresses the issues of quality, safety and efficacy, whereas the PBAC considers effectiveness and cost-effectiveness of the product relative to alternatives, as well as the overall cost to the Government. Once the PBAC has recommended a drug for listing on the PBS, the Pharmaceutical Benefits Pricing Authority (PBPA) negotiates the price with the sponsor company. The PBPA consists of government, industry and consumer representatives. After agreement is reached, the Australian Government considers the advice of both the PBAC and the PBPA and makes a decision on whether the drug will be listed on the PBS.
Under the PBS, patient contributions towards medication costs at pharmacies are capped. In 2015, general patients paid the cost of a prescription up to a maximum of $37.70. Pensioner and concession patients paid $6.10 per prescription.
In addition, there is a Safety Net Scheme to protect people with high medication needs. In 2015, once general patients and/or their immediate family incurred $1,453.90 of PBS expenditure (indexed), PBS/RPBS prescriptions for the remainder of the calendar year cost only $6.10 per prescription. Once pensioners and other concession card holders reached the concession safety net threshold of $366 expenditure (indexed), they received all remaining prescriptions in 2015 free of charge.
It is important to note that patients may be required to pay a surcharge if a doctor prescribes a more expensive brand of an item, when there are cheaper, equivalent brands of that item listed on the PBS.
As the general patient co-payment rises, the dispensed price of many cheaper medical products fall under this level. In such cases the patient pays the full price and no claim for payment was transmitted under the PBS for the period of this report. In 2015, under co-payment general prescriptions represented around 27% of community prescriptions (excluding private prescriptions). There are also many drugs that are not listed on the PBS or RPBS and are available only on private prescription, with the patient paying the full cost.
Pharmaceutical Benefits Advisory Committee
The Pharmaceutical Benefits Advisory Committee (PBAC) is an independent statutory body established on 12 May 1954, under section 100A of the National Health Act 1953. The role of PBAC is to make recommendations and give advice to the Minister about which drugs and medicinal preparations should be made available as pharmaceutical benefits. No new drug may be made available as a pharmaceutical benefit unless recommended by the PBAC.The PBAC is required by the Act to consider the effectiveness and cost of a proposed benefit compared to alternative therapies. In making its recommendations, the PBAC, on the basis of expected community usage, recommends maximum quantities and repeats, and may also recommend restrictions as to the indications where PBS subsidy is available. When recommending listings, the PBAC provides advice to the PBPA regarding comparison with alternatives or their cost effectiveness.
Further information is available on PBS website.
Drug Utilisation Sub-Committee
In 1988, the PBAC convened the Drug Utilisation Sub-Committee (DUSC) to assist it in making recommendations for listings on the PBS. Its terms of reference are:
- To develop and advise on the mechanisms for the collection, analysis and interpretation of comprehensive data on utilisation of medicines in Australia.
- To advise PBAC on changes in patterns of utilisation of medicines as a consequence of changes in their availability or subsidy restrictions and to review the utilisation of medicines, including but not restricted to expenditure impacts within the Pharmaceutical Benefits Scheme (PBS).
- To advise stakeholders within the National Medicines Policy framework on the interpretation of patterns of utilisation of medicines, including by placing the results of the data in the context of the limitations of the data.
- To identify potential problems and benefits related to patterns of utilisation of medicines.
- To evaluate policy and other interventions related to the use of medicines.
- To facilitate and promote the dissemination of information on utilisation of medicines.
- To conduct international comparisons of utilisation of medicines by interaction with
appropriate
international bodies.
Further information is available on PBS website.
National Medicines Policy
The National Medicines Policy (NMP) is a broad framework that aims to improve health outcomes for all Australian’s through access to and appropriate use of medicines.
The overall aim of the NMP is to meet medication and related service needs, so that both optimal health outcomes and economic objectives are achieved. In this context “medicines” means prescription, non-prescription and complementary healthcare products.
The NMP has four central objectives:
- timely access to the medicines that Australian’s need, at a cost individuals and the community can afford;
- medicines meeting appropriate standards of quality, safety and efficacy;
- quality use of medicines; and
- maintaining a responsible and viable medicines industry.
Further information is available on the Department of Health website.
Post-Market Reviews of Pharmaceutical Benefits Scheme Subsidised Medicines
Post-market reviews was introduced by the government as a systematic post-market approach to monitoring medicines listed on the Pharmaceutical Benefits Scheme (PBS).
The post-market review program has the following five objectives :
- Improved patient safety through better understanding of adverse events and medicine-related harms;
- Ensuring the ongoing viability of the PBS through targeted medicines usage and avoiding preventable wastage or inappropriate prescribing;
- A better understanding of medicines utiliation, to review intended clinical benefit and inform medicines evaluation processes;
- Ongoing cost-effectiveness, including through better management of clinical and economic uncertainty; and
- Overall improvements to the quality use of medicines and education for patients and prescribers.
Further information is available on PBS website.
Drug Classification
The DUSC and the Department of Health have adopted the Anatomical Therapeutic Chemical (ATC) code as recommended by the World Health Organization (WHO). It has been a goal of WHO to have an internationally accepted classification for presenting and comparing drug usage data. In 1982, the WHO Collaborating Centre for Drug Statistics Methodology (WHOCC), located in Norway, was established as a central body responsible for coordinating ATC use.
The ATC code itself is a seven digit alphanumeric code, structured in five levels, that classifies drugs according to their site of action and therapeutic and chemical characteristics.
The first level of the code is the anatomical main group. There are 14 anatomical main groups. The second and third levels are for the therapeutic subgroup and pharmacological subgroup, respectively, with a fourth level being either a chemical or therapeutic subgroup. The fifth level is the actual chemical substance.
The five levels thus are:
- anatomical main group
- pharmacological/therapeutic subgroup
- chemical/pharmacological or therapeutic subgroup
- chemical/pharmacological or therapeutic subgroup
- chemical substance (generic drug name)
For example, imatinib has the following code: L01XE01.
| L denotes | Antineoplastic and immunomodulating agents |
| L01 | Antineoplastic agents |
| L01X | Other antineoplastic agents |
| L01XE | Protein kinase inhibitors |
| L01XE01 | Imatinib |
ATC system main groups:
The 14 anatomical main groups of the ATC code are:
| A. | Alimentary tract and metabolism |
|---|---|
| B. | Blood and blood forming organs |
| C. | Cardiovascular system |
| D. | Dermatologicals |
| G. | Genitourinary system and sex hormones |
| H. | Systemic hormonal preparations, excluding sex hormones and insulins |
| J. | Anti-infectives for systemic use |
| L. | Antineoplastic and immunomodulating agents |
| M. | Musculo-skeletal system |
| N. | Nervous system |
| P. | Antiparasitic products, insecticides and repellents |
| R. | Respiratory system |
| S. | Sensory organs |
| V. | Various |
Although the ATC code extends to the generic drug level, it does not identify dosage forms, pack sizes, strengths or brand names.
The WHOCC, together with the Nordic Council on Medicines, undertakes regular revisions of the ATC system. They receive expert advice from an advisory board and an established procedure exists to manage requests for new classifications and to regularly review the current structure. Changes implemented in 2014 are included in the Anatomical Therapeutic Chemical Index (ATC) & Defined Daily Dose (DDD) additions and alterations section in this publication.
Measurement Unit
The international unit of drug utilisation adopted by the DUSC to accompany this coding system is the defined daily doses, per thousand of the population, per day (DDDs/1000/day). The defined daily dose is established by the Nordic Council on Medicines and the WHO Drug Utilisation Research Group on the basis of the assumed average dose per day of the drug, when used for its main indication by adults 2.
Use of DDDs allows for comparisons of drug utilisation independent of differences in price, preparation and quantity per prescription. It also allows comparison of the use of drugs in different therapeutic groups, and between regions and countries. Expressing drug use in DDDs/1000/day allows the aggregation of data for those drugs which have differing daily doses. The DDD, however, is only a technical unit of use and does not necessarily reflect the recommended or average prescribed dose in Australia.
The DDDs/1000/day figure is calculated from prescription data in the following way:
N x M x Q x 1000
_______________
DDD x P x D
Where:
| N | is the number of prescriptions dispensed in the year |
|---|---|
| M | is the drug mass in each unit (tablet, capsule, injection, pack etc.) (e.g. milligrams or grams, expressed in the same unit as DDD) |
| Q | is the average dispensed quantity (ie. number of units)per prescription |
| P | is the midyear Australian population for the year of data collection (see Australian Bureau of Statistics website for population figures used in this edition) |
| D | is the number of days in the year. |
The DDDs/1000/day can be calculated over other time periods such as monthly or quarterly.
For PBS items, the mass amount (M) is the amount of active drug contained in an individual dose unit e.g. tablet, capsule, suppository etc. Non-PBS items are estimated from the Pharmacy Guild survey. The data from the survey does not include information on the quantity supplied per prescription therefore the mass amount for nonsubsidised items is the total amount of active drug contained in the pack.
For prescriptions forwarded for subsidy, the average quantity dispensed (Q), is available from Department of Human Services (DHS) data. Prior to April 2012, prescriptions that are priced under the general co-payment, quantity is assumed to be the average quantity of the subsidised prescriptions for that drug (i.e. as concession, safety net and Veterans’ Affairs (Repatriation) prescriptions). From April 2012, prescriptions that are priced under the general co-payment the average quantity dispensed (Q) is available from DHS data.
For a chronically administered drug, the DDDs/1000/day figure indicates how many people, per 1000 of the population, may, in theory, have received a standard dose (as defined by the DDD) daily.
For drugs used intermittently, for example antiinfectives, usage expressed in DDDs/1000 /day may similarly give a rough estimate of the average proportion of the population using these drugs every day. To estimate the number of patients treated during the year supplementary information, such as the average duration of treatment, is necessary 2.
The ATC/DDD methodology has a number of limitations. All drugs dispensed are not necessarily consumed and the DDDs/1000/day is calculated for the total population, while drug use may be concentrated in certain age groups or a particular sex.
It is difficult to assign a DDD, and on occasions an ATC code, to some preparations that have multiple active ingredients. For some drug groups, such as the dermatological and antineoplastic drugs, highly individualised use and wide dose ranges, as well as the experimental nature of some of the therapy, make it difficult to define a daily dose. Consequently, there may be a delay between the marketing of a drug and the availability of an ATC code and its associated DDD.
Generally agreed indications for use of a drug may be re-evaluated in light of experience with adverse reactions and other pharmacological effects. Drugs may have multiple indications and it may be difficult to determine a preparation’s use. Also, the DDD is based on overseas experience and may not reflect the prescribed adult dose in Australia.
As more medicinal products are listed on the PBS in formulations of two or more combinations the DUSC has considered that it is important to record the contribution, in terms of DDDs, of each constituent where appropriate. Therefore additional information on the contribution of the constituents of combination pharmaceutical items in addition to single component items will be reported in table 2.
Department of Human Services processing
In 1990, the processing of prescriptions submitted for payment of a subsidy under the PBS/RPBS was taken over by the Health Insurance Commission, now the Department of Human Services (DHS). Daily data transmissions, containing prescription records that do not allow the identification of an individual patient, are provided by the DHS to the Department of Health for summarisation.
On 1 April 2012, DHS started collecting actual under-copayment prescriptions and these were also provided to the Department of Health along with the PBS/RPBS subsidised prescription data.
Adverse Event Reporting in Australia in 2015
The TGA's reporting system for adverse events began in the late 1960s with the computerised database dating back to the early 1970s. By the end of 2015 there were approximately 312,000 reports of suspected adverse events in the database.
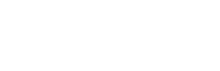
Figure A: Origin of medicine and vaccine adverse events received by the TGA (2011‑15)
In 2015 the TGA received approximately 17,000 reports of adverse events. As shown in Figure 1, the majority of reports made in 2015 were by sponsors. The number of reports made by sponsors steadily increased from 2011 (7414) to 2013 (9563), before it decreased in 2014 (8359) and rose again in 2015 (9286).
Of the 17,000 total adverse event reports received by the TGA in 2015, approximately 54% (9286) were from sponsors; 15% (2516) from State and Territory Health Departments (reports of adverse events following immunisation); 14% (2381) from hospitals and hospital pharmacists; 6% (1105) from community pharmacists; 4% (675) from general practitioners (GPs); 4% (654) from consumers; and 3% (470) from other sources.
Other than the aforementioned increase in reports from sponsors, the numbers of reports made by each of the sources during 2015 were similar to those made the previous year.
While health professionals are encouraged to report suspected adverse events directly to the TGA, they can also report to the sponsor or manufacturer.
Processing and use of adverse event reports
The PSAB assessed adverse event reports submitted to the TGA by checking for the presence of ‘minimum’ details, including an individual patient, an adverse event, at least one (suspected) medicine or vaccine, and an identifiable reporter. The specific adverse event terms are identified along with the suspected, interacting or 'other' therapeutic products and these are entered into the database.
The PSAB assesses causality of adverse event(s) and in some cases requests further
clinical or laboratory information from the reporter. Medical officers review serious
reports and branch staff regularly analyse reporting data to identify potential safety
signals.
Reports are forwarded to the Uppsala Monitoring Centre in Sweden, which administers
the World Health Organization Collaborating Centre for International Drug Monitoring.
This global database began in 1968 as a pilot program involving 10 nations, including
Australia, and now receives reports from more than 80 nations.
Database of adverse events notifications
Information in the publicly searchable Database of Adverse Event Notifications (DAEN) comes from reports made to the TGA by a wide range of sources, including members of the public, general practitioners, nurses, other health professionals and the therapeutic goods industry. Reports in this database start from 1 January 1971 up to three months prior to the date of access. The TGA uses this three-month period to investigate each adverse event report.
The DAEN, which was launched in 2012, was created to support better health outcomes by providing access to the information that the TGA gathers while monitoring medicine and vaccine safety in Australia.
‘Safefy through reporting’ online learning modules developed for health professionals
The TGA and NPS MedicineWise worked together to create two interactive online learning modules designed to improve adverse event reporting by health professionals and these tools
were launched in December 2014.
The ‘Safety through reporting’ modules were developed to increase health professionals'
existing knowledge around reporting adverse events associated with therapeutic products.
Some of the key features include:
- the importance of reporting adverse events
- sharing the responsibility of reporting
- how to build reporting into practice
- what happens to reports once they are submitted to the TGA.
Health professionals who complete the modules are eligible for continuing professional development points from the relevant accrediting health professional bodies.
Reporting adverse events
The TGA encourages the reporting of all suspected adverse events to medicines and vaccines available in Australia, including prescription medicines, over the counter and complementary medicines. The reporting of seemingly insignificant or common adverse events can contribute to the TGA's investigation of a potential safety signal.
The TGA particularly encourages reporting of:
- suspected adverse events involving new medicines and vaccines
- suspected medicine and vaccine interactions
- unexplained adverse events (adverse events that are not described in the Product Information)
- serious adverse events, such as those suspected of causing:
- inability to work
- admission to hospital
- prolongation of hospitalisation
- increased investigation or treatment costs
- danger to life
- birth defects
- death.
For further information about reporting suspected adverse events, visit the TGA website (click on 'Report a Problem').
Sponsors of all medicines and vaccines on the ARTG have mandatory reporting requirements regarding adverse events.
Expert advisory committee
Advisory Committee on the Safety of Medicines
Advisory Committee on the Safety of Medicines (ACSOM) was established in January 2010 to provide expert advice to the TGA about safety issues under investigation and the appropriateness of Risk Management Plans (RMPs). RMPs outline sponsors' plans to monitor and communicate risks, and are evaluated as part of the registration process for new medicines. RMPs accompany applications for registration of high risk medicines, such as new chemical entities. RMPs characterise and pro-actively manage risks relating to a medicine over its entire life cycle. ACSOM also provides advice to the TGA on other matters related to pharmacovigilance, including the detection, assessment, understanding and prevention of adverse events. ACSOM meeting statements are published on the TGA website.
Advisory Committee on the Safety of Vaccines
Following a recommendation from the government’s Review of the management of adverse events associated with Panvax and Fluvax in 2012 ‘to consider the current governance arrangements for monitoring and responding to vaccine safety issues in Australia and make recommendations for an improved system of governance for vaccine safety monitoring’, the Advisory Committee on the Safety of Vaccines (ACSOV) was established in the Therapeutic Goods Regulations. The functions of ACSOV are to provide advice and make recommendations to the Minister for Health, the TGA and the Office of Health Protection on the safety, risk assessment and risk management of vaccines. ACSOV meeting statements are published on the TGA website.
Medicines Safety Update
The Medicines Safety Update was published six times during 2015. It was published on the TGA website. Medicines Safety Update replaced the Australian Adverse Drug Reactions Bulletin in 2010.
The following articles were published in Medicines Safety Update during 2015:
- Combined oral contraceptives and hormone replacement therapy - inflammatory bowel disease
- Metoclopramide and neurological adverse events
- Publication changes for Medicines Safety Update
- 2015 seasonal influenza vaccines
- Agomelatine (Valdoxan) – monitoring of liver function
- Non-steroidal anti-inflammatory drugs and diclofenac reviews
- Methotrexate and hepatitis B reactivation
- Ivabradine and cardiovascular events in patients with angina
- Ethinylestradiol/etonogestrel vaginal ring and thromboembolic risk
- Risperidone and risk of cerebrovascular adverse events
- Infliximab and non-melanoma skin cancers
- Tramadol oral drops
- Ustekinumab
- Sodium glucose co-transporter 2 inhibitors and diabetic ketoacidosis
- Registering to report adverse events online
- TGA investigates proton pump inhibitors and increased cardiovascular risk
- Potential interaction – allopurinol and 6-mercaptopurine/azathioprine
- Intrauterine contraceptive devices and uterine perforation
- Peginterferon alfa-2a and facial palsy.
Product vigilance
The TGA applies a risk management approach to ensure therapeutic goods supplied in Australia meet acceptable standards of quality, safety and efficacy. Once a therapeutic product is approved, the TGA continues to monitor the product in the market through therapeutic product vigilance activities.
The aim of therapeutic product vigilance is to continually monitor and evaluate the safety and efficacy (performance) profile of therapeutic goods and to manage any risks associated with individual products over their life cycle. The TGA's therapeutic product vigilance framework is available on the TGA website at Therapeutic product vigilance.
The maintenance and improvement of health and safety is a shared responsibility. In addition to government and industry, health professionals, consumers and their respective associations play an important role in reporting safety related issues.
Sponsors have the primary responsibility for the safety of any therapeutic products they import into, supply in or export from Australia. Sponsors must comply with legislative requirements for therapeutic product vigilance under the Therapeutic Goods Act 1989 (the Act) and there are applicable offences and penalties under the Act for not complying. The legislative requirements for therapeutic product vigilance vary depending on the type of therapeutic good.
The TGA maintains up-to-date safety information on therapeutic products that is communicated through a variety of means to consumers and health professionals. The TGA is committed to advancing public health through market authorisation of beneficial, innovative therapeutic goods and by providing timely, evidence-based and authoritative information to allow consumers and health professionals to make informed decisions.
The TGA defines therapeutic product vigilance tools as tools designed to facilitate the collection and evaluation of information pertaining to the benefits and risks associated with the use of therapeutic products. The main product vigilance tools used by the PSAB are adverse event reports, RMPs and Periodic Safety Update Reports (PSURs).
Adverse event reports are reports of any unwanted and sometimes harmful occurrences from using medicines, vaccines or medical devices (collectively known as therapeutic goods). Importantly, adverse events related to the use of a therapeutic good are not always caused by the therapeutic good itself.
RMPs provide a summary of the known important safety information about the therapeutic product, plans to identify and characterise known or potential safety concerns and plans to minimise any identified or potential safety risk. A full outline of the scope of RMPs is above (see ‘Expert advisory committee’). PSURs give an annual overview of the safety of the product, including adverse events, a summary of its registration status world-wide, actions taken for safety reasons, the world-wide usage of the product and an analysis of safety requirements. Sponsors must submit PSURs to the TGA for at least three years after registration of a product.
An important aspect of product vigilance is ensuring there are mechanisms to communicate safety information to both consumers and health professionals. To achieve this, the TGA publishes Australian Public Assessment Reports (AusPARs) about recently registered prescription medicines and vaccines on the TGA website. AusPARs outline the findings of the TGA's evaluation of a product including important effectiveness and safety information.
Each adverse event report the TGA receives is entered into a database, which is continually analysed by TGA staff to identify potential emerging problems for detailed investigation.
If the TGA identifies a safety concern relating to a medicine or vaccine, we can take regulatory action. This can include:
- informing health professionals and consumers via safety alerts, Early Warning System monitoring communications and Medicines Safety Update, which provide information and recommendations about therapeutic goods
- updating the Product Information, Consumer Medicine Information and/or product labelling with new adverse effects, precautions or warnings
- requiring post-marketing studies
- imposing limits on their use
- investigating manufacturing sites
- recalling products from the market
- suspending or cancelling products.
When a product is cancelled, details are published on the TGA website.
Supply of Pharmaceutical Benefits to Remote Area Aboriginal Health Services under section 100 of the National Health Act
The S100 Supply Arrangements for Remote Area Aboriginal Health Services (AHSs) improve access to the PBS for clients of remote area AHSs under Section 100 of the National Health Act 1953.
Under these arrangements, clients of participating AHSs are able to receive PBS medicines directly from the AHS at the point of consultation, without the need for a normal prescription form, and without charge.
The eligibility criteria for participation in the program are given below.
Eligibility criteria
- The health service must have a primary function of meeting the health care needs of Aboriginal and Torres Strait Islander peoples.
- The clinic or other health care facility operated by the AHS from which pharmaceuticals are supplied to patients must be in a remote zone as defined in the Rural, Remote and Metropolitan Areas Classification 1991 Census Edition.
- The AHS must not be a party to an arrangement, such as a coordinated care trial, for which funds from the PBS have already been provided.
- The AHS must employ or be in a contractual relationship with health professionals who are suitably qualified under relevant State/Territory legislation to supply all medications covered by the Section 100 arrangements and undertake that all supply of benefit items will be under the direction of such qualified persons.
- The clinic or other health care facility operated by the AHS from which pharmaceuticals are supplied must have storage facilities that will:
- prevent access by unauthorised persons;
- maintain the quality (eg chemical and biological stability and sterility) of the pharmaceutical; and
- comply with any special conditions specified by the manufacturer of the pharmaceutical.
Further information is available on the Department of Health website.
Expenditure
In 2015, 161 remote area Aboriginal Health Services (AHS) were approved to participate in the Remote Area Aboriginal Health Services (RAAHS) Programme and 153 AHS actually received supply of PBS medicines in that period (note: although approved, some AHS may elect not to participate, or may participate on an intermittent basis). Participating AHS in 2015 were from remote locations in Northern Territory, Queensland, Western Australia, South Australia, New South Wales and Tasmania. RAAHS Programme expenditure on PBS medicines in 2015 was $28.3 million.
Drug Utilisation Trends
Anatomical Therapeutic Chemical (ATC) classification index with Defined Daily Doses (DDDs) 2016 is used in all statistics published in this edition (refer to WHO collaborating Centre for Drug Statistics Methodology, ATC classification index with DDDs 2016).
Listed below are the prescription counts for 2013, 2014 and 2015 by ATC anatomical main group.
Table A (i) shows subsidised prescriptions (PBS/RPBS) and Table A (ii) shows non subsidised prescriptions (under co-payment).
Tables A: Prescription numbers by ATC groups
Table A (i): Subsidised prescriptions (PBS/RPBS)
| ATC Group | 2013 | 2014 | 2015 |
|---|---|---|---|
| (A) Alimentary Tract | 30,285,538 | 31,184,729 | 31,769,327 |
| (B) Blood and blood forming | 9,315,858 | 9,675,843 | 10,019,801 |
| (C) Cardiovascular system | 70,372,716 | 68,145,369 | 66,613,110 |
| (D) Dermatologicals | 3,164,607 | 3,170,787 | 3,079,839 |
| (G) Genitourinary system | 3,381,145 | 3,540,065 | 3,601,733 |
| (H) Hormonal preparations | 3,318,623 | 3,469,552 | 3,587,541 |
| (J) Antiinfectives | 13,655,746 | 13,991,091 | 14,173,359 |
| (L) Antineoplastic | 3,149,116 | 3,358,857 | 3,557,383 |
| (M) Musculo-skeletal | 8,476,404 | 8,172,911 | 7,850,114 |
| (N) Nervous system | 47,418,280 | 49,428,420 | 50,927,262 |
| (P) Antiparasitic products | 611,474 | 610,344 | 604,857 |
| (R) Respiratory system | 11,676,550 | 11,875,303 | 12,042,449 |
| (S) Sensory Organs | 8,895,292 | 8,612,286 | 8,620,689 |
| (V) Various | 627,787 | 613,905 | 596,042 |
| Other | 171,128 | 169,507 | 176,871 |
| Total | 214,520,264 | 216,018,969 | 217,220,377 |
Table A (ii): Under co-payment prescriptions (non-subsidised)
| ATC Group | 2013 | 2014 | 2015 |
|---|---|---|---|
| (A) Alimentary Tract | 7,631,763 | 8,186,957 | 8,566,538 |
| (B) Blood and blood forming | 1,001,367 | 1,148,833 | 1,172,887 |
| (C) Cardiovascular system | 18,162,624 | 21,119,235 | 23,820,941 |
| (D) Dermatologicals | 1,408,312 | 1,455,662 | 1,584,135 |
| (G) Genitourinary system | 3,181,543 | 3,331,238 | 3,278,334 |
| (H) Hormonal preparations | 2,215,227 | 2,376,895 | 2,515,752 |
| (J) Antiinfectives | 13,948,421 | 14,532,188 | 14,682,142 |
| (L) Antineoplastic | 67,966 | 89,334 | 156,039 |
| (M) Musculo-skeletal | 3,362,764 | 3,445,060 | 3,543,861 |
| (N) Nervous system | 12,878,587 | 14,899,247 | 16,590,718 |
| (P) Antiparasitic products | 620,536 | 629,849 | 624,767 |
| (R) Respiratory system | 1,174,757 | 1,227,951 | 1,386,652 |
| (S) Sensory Organs | 1,794,070 | 1,978,815 | 2,079,557 |
| (V) Various | 5,032 | 10,039 | 11,699 |
| Other | 49,380 | 47,999 | 46,484 |
| Total | 67,502,349 | 74,479,302 | 80,060,506 |
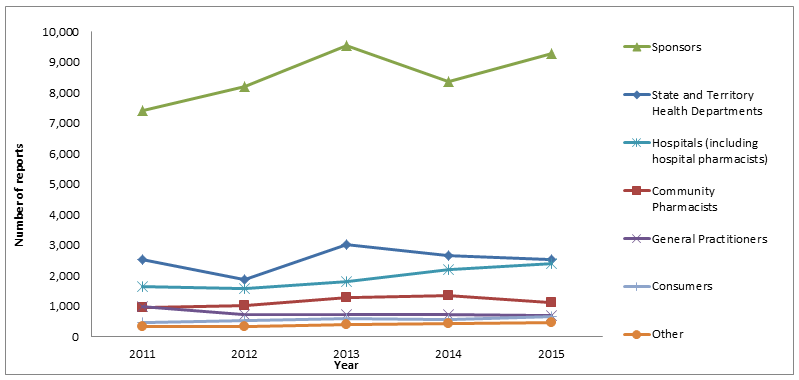
Estimated changes from 2006 to 2015 in the number of prescriptions dispensed under the PBS (concession and general), RPBS, under co-payment and private categories, are presented in Figure B. Note that private prescriptions data are not available from 2012.
Figure B: Number of prescriptions by type of service
Most commonly used drugs in the Australian community for 2015
Table B shows the top 10 drugs dispensed in the Australian community by DDDs/1000 population/day, which adjusts for the quantity dispensed per prescription. This DDDs/1000/day information shows both the subsidised (PBS/RPBS) and non-subsidised components, as well as total community use (excluding private usage). Changes and alterations from the previous years are also shown.
Table B: Top 10 drugs by defined daily dose/thousand population/day, 2015 (including the contribution of constituents of combination products)
| Drug | PBS/RPBS | Under co-payment | Total |
|---|---|---|---|
| ATORVASTATIN | 52.65 | 17.34 | 69.99 |
| PERINDOPRIL | 33.64 | 15.30 | 48.95 |
| ROSUVASTATIN | 36.13 | 11.23 | 47.36 |
| AMLODIPINE | 30.54 | 10.81 | 41.35 |
| PARACETAMOL | 36.44 | 2.36 | 38.80 |
| IRBESARTAN | 26.21 | 11.41 | 37.63 |
| CANDESARTAN | 22.89 | 11.04 | 33.93 |
| RAMIPRIL | 20.74 | 9.74 | 30.48 |
| TELMISARTAN | 18.74 | 10.84 | 29.58 |
| ESOMEPRAZOLE | 24.85 | 3.93 | 28.78 |
Changes from 2014:
| UP: | Amlodipine (5 Paracetamol (6 Telmisartan (10 |
| DOWN: | Irbesartan (4 Esomeprazole (9 |
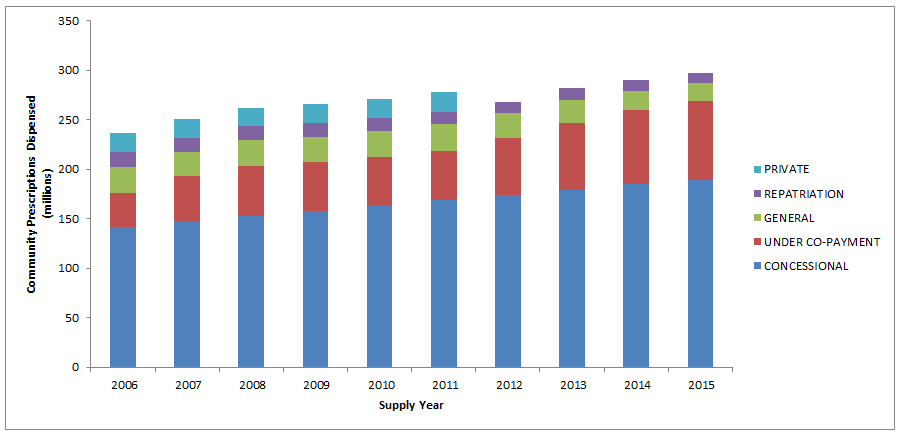
The top 10 drugs dispensed in the Australian community (excluding private prescriptions) in 2015, ranked by prescription count, are shown in table C. Table D ranks the 2015 top 10 drugs by total cost to Australia, i.e. subsidised prescriptions only (total cost is the sum of patient contribution and cost to Government).
Table C: Top 10 drugs by prescription counts, 2015
| Drug | PBS/RPBS | Under co-payment | Total |
|---|---|---|---|
| ATORVASTATIN | 7,634,687 | 2,922,825 | 10,557,512 |
| ROSUVASTATIN | 6,667,654 | 2,764,678 | 9,432,332 |
| ESOMEPRAZOLE | 7,184,175 | 1,684,090 | 8,868,265 |
| PARACETAMOL | 7,003,988 | 361,643 | 7,365,631 |
| PANTOPRAZOLE | 4,618,171 | 1,738,738 | 6,356,909 |
| PERINDOPRIL | 4,005,504 | 2,114,337 | 6,119,841 |
| AMOXYCILLIN | 2,377,339 | 3,487,319 | 5,864,658 |
| CEFALEXIN | 2,851,477 | 2,753,113 | 5,604,590 |
| METFORMIN HYDROCHLORIDE | 3,570,613 | 1,585,270 | 5,155,883 |
| AMOXYCILLIN with CLAVULANIC ACID | 2,256,829 | 2,810,399 | 5,067,228 |
Changes from 2014:
| UP: | Rosuvastatin Pantoprazole (6 |
| DOWN: | Esomeprazole (2 Perindopril ((5 |
Table D: Top 10 PBS/RPBS drugs by total cost to Australia, 2015
| Drug | DDD/1000/Pop | Scripts | Total Cost |
|---|---|---|---|
| ADALIMUMAB | 0.60 | 185,246 | 329,711,021 |
| ESOMEPRAZOLE | 24.85 | 7,184,175 | 229,567,718 |
| RANIBIZUMAB | 137,201 | 213,608,450 | |
| AFLIBERCEPT | 132,792 | 208,351,224 | |
| SALMETEROL and FLUTICASONE | 3,081,584 | 204,998,295 | |
| ROSUVASTATIN | 36.13 | 6,667,654 | 202,920,536 |
| ETANERCEPT | 0.32 | 95,800 | 168,593,840 |
| PREGABALIN | 6.75 | 2,958,702 | 161,937,157 |
| INSULIN GLARGINE | 7.61 | 359,843 | 150,832,113 |
| RITUXIMAB | 45,996 | 147,655,378 |
Changes from 2014:
| UP: | Adalimumab (2 Esomeprazole (3 Ranibizumab (7 Aflibercept (6 Etanercept (9 Pregabalin (unranked Insulin glargine (unranked |
| DOWN: | Rituximab (8 |
Figure C shows the top 10 subsidised drugs dispensed in 2015.
Figure C: Top 10 subsidised drugs dispensed in 2015
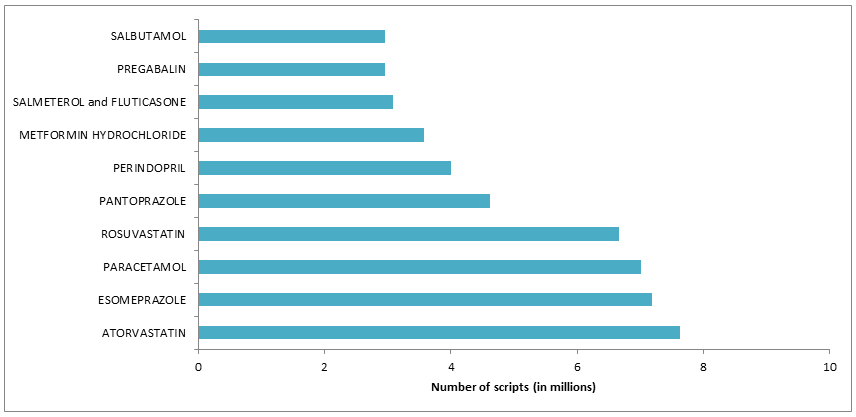
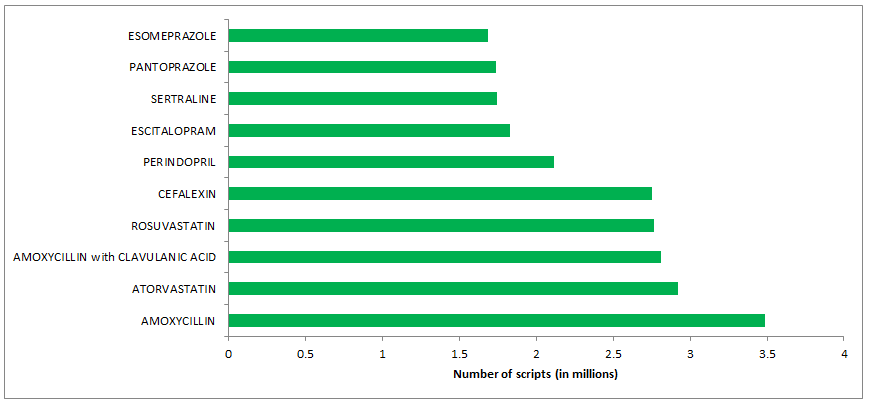
Figure D represents the top 10 under co-payment drugs dispensed in 2015.
Figure D: Top 10 under co-payment drugs dispensed in 2015
Nurse Prescribing
From 1 November 2010, authorised nurse practitioners can write PBS/RPBS prescriptions listed in the PBS Schedule with a flag of “NP”. Medicines without this flag are not to be prescribed by authorised nurse practitioners. Refer to Schedule of Pharmaceutical Benefits available on the PBS website for details of subsidised medicines.
Information for how nurse practitioners can become authorised PBS prescribers is available from the Department of Human Services website.
Table E shows the top 10 PBS/RPBS drugs prescribed by nurse practitioners and dispensed in 2015. Table F ranks the 2015 top 10 drugs prescribed by total cost.
Table E: Nurse Practitioner—Top 10 PBS/RPBS drugs by prescription counts, 2015
| Drug | PBS/RPBS Prescriptions |
|---|---|
| PARACETAMOL | 12,859 |
| ATORVASTATIN | 7,875 |
| ESOMEPRAZOLE | 6,888 |
| PANTOPRAZOLE | 6,656 |
| CEPHALEXIN | 6,123 |
| PERINDOPRIL | 5,659 |
| ROSUVASTATIN | 5,324 |
| OXYCODONE | 4,780 |
| METFORMIN HYDROCHLORIDE | 4,673 |
| SALBUTAMOL | 4,022 |
Table F: Nurse Practitioner—Top 10 PBS/RPBS drugs prescribed by total cost, 2015
| Drug | Total Cost ($) |
|---|---|
| INSULIN GLARGINE | 444,167 |
| PALIPERIDONE | 307,889 |
| INSULIN ASPART | 249,155 |
| PANCREATIC EXTRACT | 232,255 |
| SALMETEROL and FLUTICASONE | 224,584 |
| ESOMEPRAZOLE | 221,535 |
| PARACETAMOL | 204,171 |
| ENOXAPARIN | 201,352 |
| PREGABALIN | 172,197 |
| RISPERIDONE | 163,484 |
Optometrist Prescribing
Since 1 January 2008, authorised optometrists are able to prescribe medicines listed in the optometrist section of the Pharmaceutical Benefits Schedule. Refer to Pharmaceutical Benefits Schedule for a list of medicines that can be prescribed by authorised optometrists.
Table G shows the top 10 PBS/RPBS drugs prescribed by optometrists and dispensed in 2015. Table H ranks the 2015 top 10 drugs prescribed by total cost.
Table G: Optometrist—Top 10 PBS/RPBS drugs by prescription counts, 2015
| Drug | PBS/RPBS Prescriptions |
|---|---|
| LATANOPROST | 17,260 |
| FLUOROMETHOLONE | 13,459 |
| CHLORAMPHENICOL | 8,476 |
| POLYETHYLENE GLYCOL 400 with PROPYLENE GLYCOL | 7,487 |
| TIMOLOL with LATANOPROST | 5,896 |
| CARMELLOSE SODIUM | 4,607 |
| PARAFFIN | 3,596 |
| BIMATOPROST | 3,573 |
| PREDNISOLONE and MYDRIATICS | 3,152 |
| CARMELLOSE SODIUM with GLYCERIN | 2,971 |
Table H: Optometrist—Top 10 PBS/RPBS drugs prescribed by total cost, 2015
| Drug | Total Cost ($) |
|---|---|
| LATANOPROST | 448,341 |
| TIMOLOL with LATANOPROST | 240,291 |
| FLUOROMETHOLONE | 169,967 |
| BIMATOPROST | 146,318 |
| TRAVOPROST | 119,504 |
| POLYETHYLENE GLYCOL 400 with PROPYLENE GLYCOL | 115,977 |
| TIMOLOL with TRAVOPROST | 112,274 |
| CHLORAMPHENICOL | 106,399 |
| CARMELLOSE SODIUM | 88,308 |
| BIMATOPROST with TIMOLOL MALEATE | 84,754 |
Tables in the Australian Statistics on Medicines
The data are presented in two major tables.
Table 1: 2015 Under Copayment and PBS/RPBS Prescription Numbers for PBS Listed Drugs
- Table 1 provides 2015 community prescription numbers for both subsidised and under-copayment prescriptions. The defined daily dose (DDD), where available, is also included for the drugs covered in the report.
- S100 HSD Public hospital prescriptions data have been included in this edition and 2014 editions. Prior to 2014, this was not possible due to different processing arrangements.
- Table 1 (Excel 333 KB)
Table 2: Prescription Drug use, in DDD/1000/Day, for 2013 to 2015
- Table 2 includes prescription drug use, in DDDs/1000 population/day, for the years 2013, 2014 and 2015. DDDs/1000 population/day for combination products is also reported in terms of DDDs of each constituent. One main advantage of reporting combinations as if they were administered as two or more single component products is that total DDDs remain constant as patients switch to combination products, if the amounts of constituent drugs consumed by patients remain the same.
- S100 HSD Public hospital prescriptions data have been included in this edition and 2014 editions. Prior to 2014, this was not possible due to different processing arrangements.
- Table 2 (Excel 206 KB)
Note that not all combination products are included in table 2. Combination drugs will only be reported in terms of DDD of each constituent where:
- the constituent drugs were available as plain drugs on the PBS;
- the combination was a frequently prescribed form;
- the constituent drugs had independent actions; and
- the WHO Defined Daily Dose was consistent across the various formulations of the constituent drugs.
Anatomical Therapeutic Chemical (ATC) classification index with Defined Daily Doses (DDDs) 2016 is used in statistics published in this edition (refer to WHO collaborating Centre for Drug Statistics Methodology, ATC classification index with DDDs 2016).
References
(1) Edmonds DJ, Dumbrell DM, Primrose JG, McManus P, Birkett DJ, Demirian V. Development of an Australian drug utilisation database: a report from the Drug Utilisation Subcommittee of the Pharmaceutical Benefits Advisory Committee, PharmacoEconomics 1993; 3(6): 427432.
(2) Nordic Council on Medicines. Nordic Statistics on Medicines 1987-1989. NLN publication number 3, Uppsala, Sweden, 1990.
Caveats
It needs to be borne in mind that these utilisation data do not include a large proportion of public hospital drug usage, over the counter purchases (except for S3 Recordable) or private prescriptions. Some extemporaneously prepared items may also not be included.
Comments on classifications, omissions or errata appearing in this edition of the Australian Statistics on Medicines may be sent to:
Paul Storey
Director
PBS Information Management Section
Department of Health
GPO Box 9848
CANBERRA ACT 2601.
e-mail: pbsstats@health.gov.au
Glossary of Terms
| Actu | Actuated |
| Adhes | Adhesive |
| Admin | Administration |
| Aero | Aerosol |
| Amp(s) | Ampoule(s) |
| Applic | Applicator |
| Aqu | Aqueous |
| Breth | Breath |
| Calc | Calcium |
| Cap(s) | Capsule(s) |
| Cart | Cartridge |
| CD | Controlled delivery |
| Chew | Chewable |
| Clean | Cleansing |
| Coat | Coated |
| Co | Compound |
| Conc | Concentrated |
| Cont | Contained |
| CR | Controlled release |
| Crm | Cream |
| Crush | Crushable |
| D | Dose |
| Dev | Device |
| Diag | Diagnostic |
| Dil | Diluted |
| Disp | Dispersable |
| Dres | Dressing |
| Drp | Drops |
| Ds | Doses |
| Dust | Dusting |
| Efferv | Effervescent |
| Elx | Elixir |
| Enter | Enteric |
| Emulsif | Emulsifying |
| Equiv | Equivalent |
| Extend | Extended |
| Ferr | Ferrous |
| Gran | Granules |
| Inf | Infusion |
| Inhal | Inhalation |
| Inj(s) | Injection(s) |
| Inrt | Inert |
| Ins | Insert |
| Intracav | Intracavernosal |
| Intranas | Intranasal |
| Insuff | Insufflator |
| Irrig | Irrigation |
| Jel | Jelly |
| Linct | Linctus |
| Lin | Liniment |
| Liq | Liquid |
| Loz | Lozenge |
| Ltn | Lotion |
| Metronid | Metronidazole |
| Mixt | Mixture |
| Nas | Nasal |
| Nebu | Nebuliser |
| Not< | Not less than |
| Oint | Ointment |
| Ophth | Ophthalmic |
| Paed | Paediatric |
| Pdr | Powder |
| Pell(s) | Pellet(s) |
| Pess | Pessary |
| Phos | Phosphorus |
| Pot | Potassium |
| Prep | Preparation |
| Press | Pressurised |
| Prot | Protective |
| Pst | Paste |
| Reag | Reagent |
| Rel | Release |
| Requ | Required |
| Sach(s) | Sachet(s) |
| SF | Sugar free |
| Sng | Single |
| Sod | Sodium |
| Sol | Soluble |
| Soln | Solution |
| Solv | Solvent |
| Spr | Spray |
| Ster | Sterile |
| Sulph | Sulphate |
| Suppl | Supplement |
| Suppos | Suppository |
| Supres | Suppression |
| Susp | Suspension |
| Sust | Sustained |
| Syrp | Syrup |
| Syrng | Syringe |
| Tab(s) | Tablet(s) |
| Td | Transdermal |
| Tinct | Tincture |
| Top | Topical |
| Unt(s) | Unit(s) |
| wps | Wipes |
Weights and Measures
| cm | centimetre(s) |
| E | unit(s) |
| g | gram(s) |
| kg | kilogram(s) |
| iu | international unit |
| L | litre(s) |
| m | metre(s) |
| ME | million units |
| mm | millimetre(s) |
| mg | milligram(s) |
| mL | millilitre(s) |
| mmol | Millimole |
| TE | thousand units |
| ug | micrograms(s) |
ATC & DDD Additions and Alterations (2016)
Alterations in ATC classification
| Previous ATC code | ATC level name | New ATC code |
|---|---|---|
| B03AB06 | ferric citrate | V03AE08 |
| A12AA12 | calcium acetate | V03AE07 |
Alterations in DDDs
| ATC code | ATC level name | Previous DDD | New DDD |
|---|---|---|---|
| B01AF01 | rivaroxaban | 10 mg O | 20 mg O |
| G03GA02 | human menopausal gonadotrophin | 30 U P | 75 U P |
| B01AE07 | Dabigatran etexilate | 0.22 g O | 0.3 g O |
| B01AF02 | apixaban | 5 mg O | 10 mg O |
Full details on current ATC coding and defined daily doses (DDDs) can be obtained from the DUSC Secretary, Department of Health, GPO Box 9848, Canberra ACT 2601, or direct from the coordinating body: the WHO Collaborating Centre for Drug Statistics Methodology, Norwegian Institute of Public Health, PO BOX 4404 Nydalen 0403 Oslo Norway, or at the WHO website.